Description
AI Demand & Connectivity Atlas
Forecast where AI-driven data centre demand lands across APAC.
The AI Demand & Connectivity Atlas links data centre supply, workload demand, GW growth and network intensity to forecast how AI training, AI inference, cloud, video and physical AI workloads reshape APAC data centre clusters.
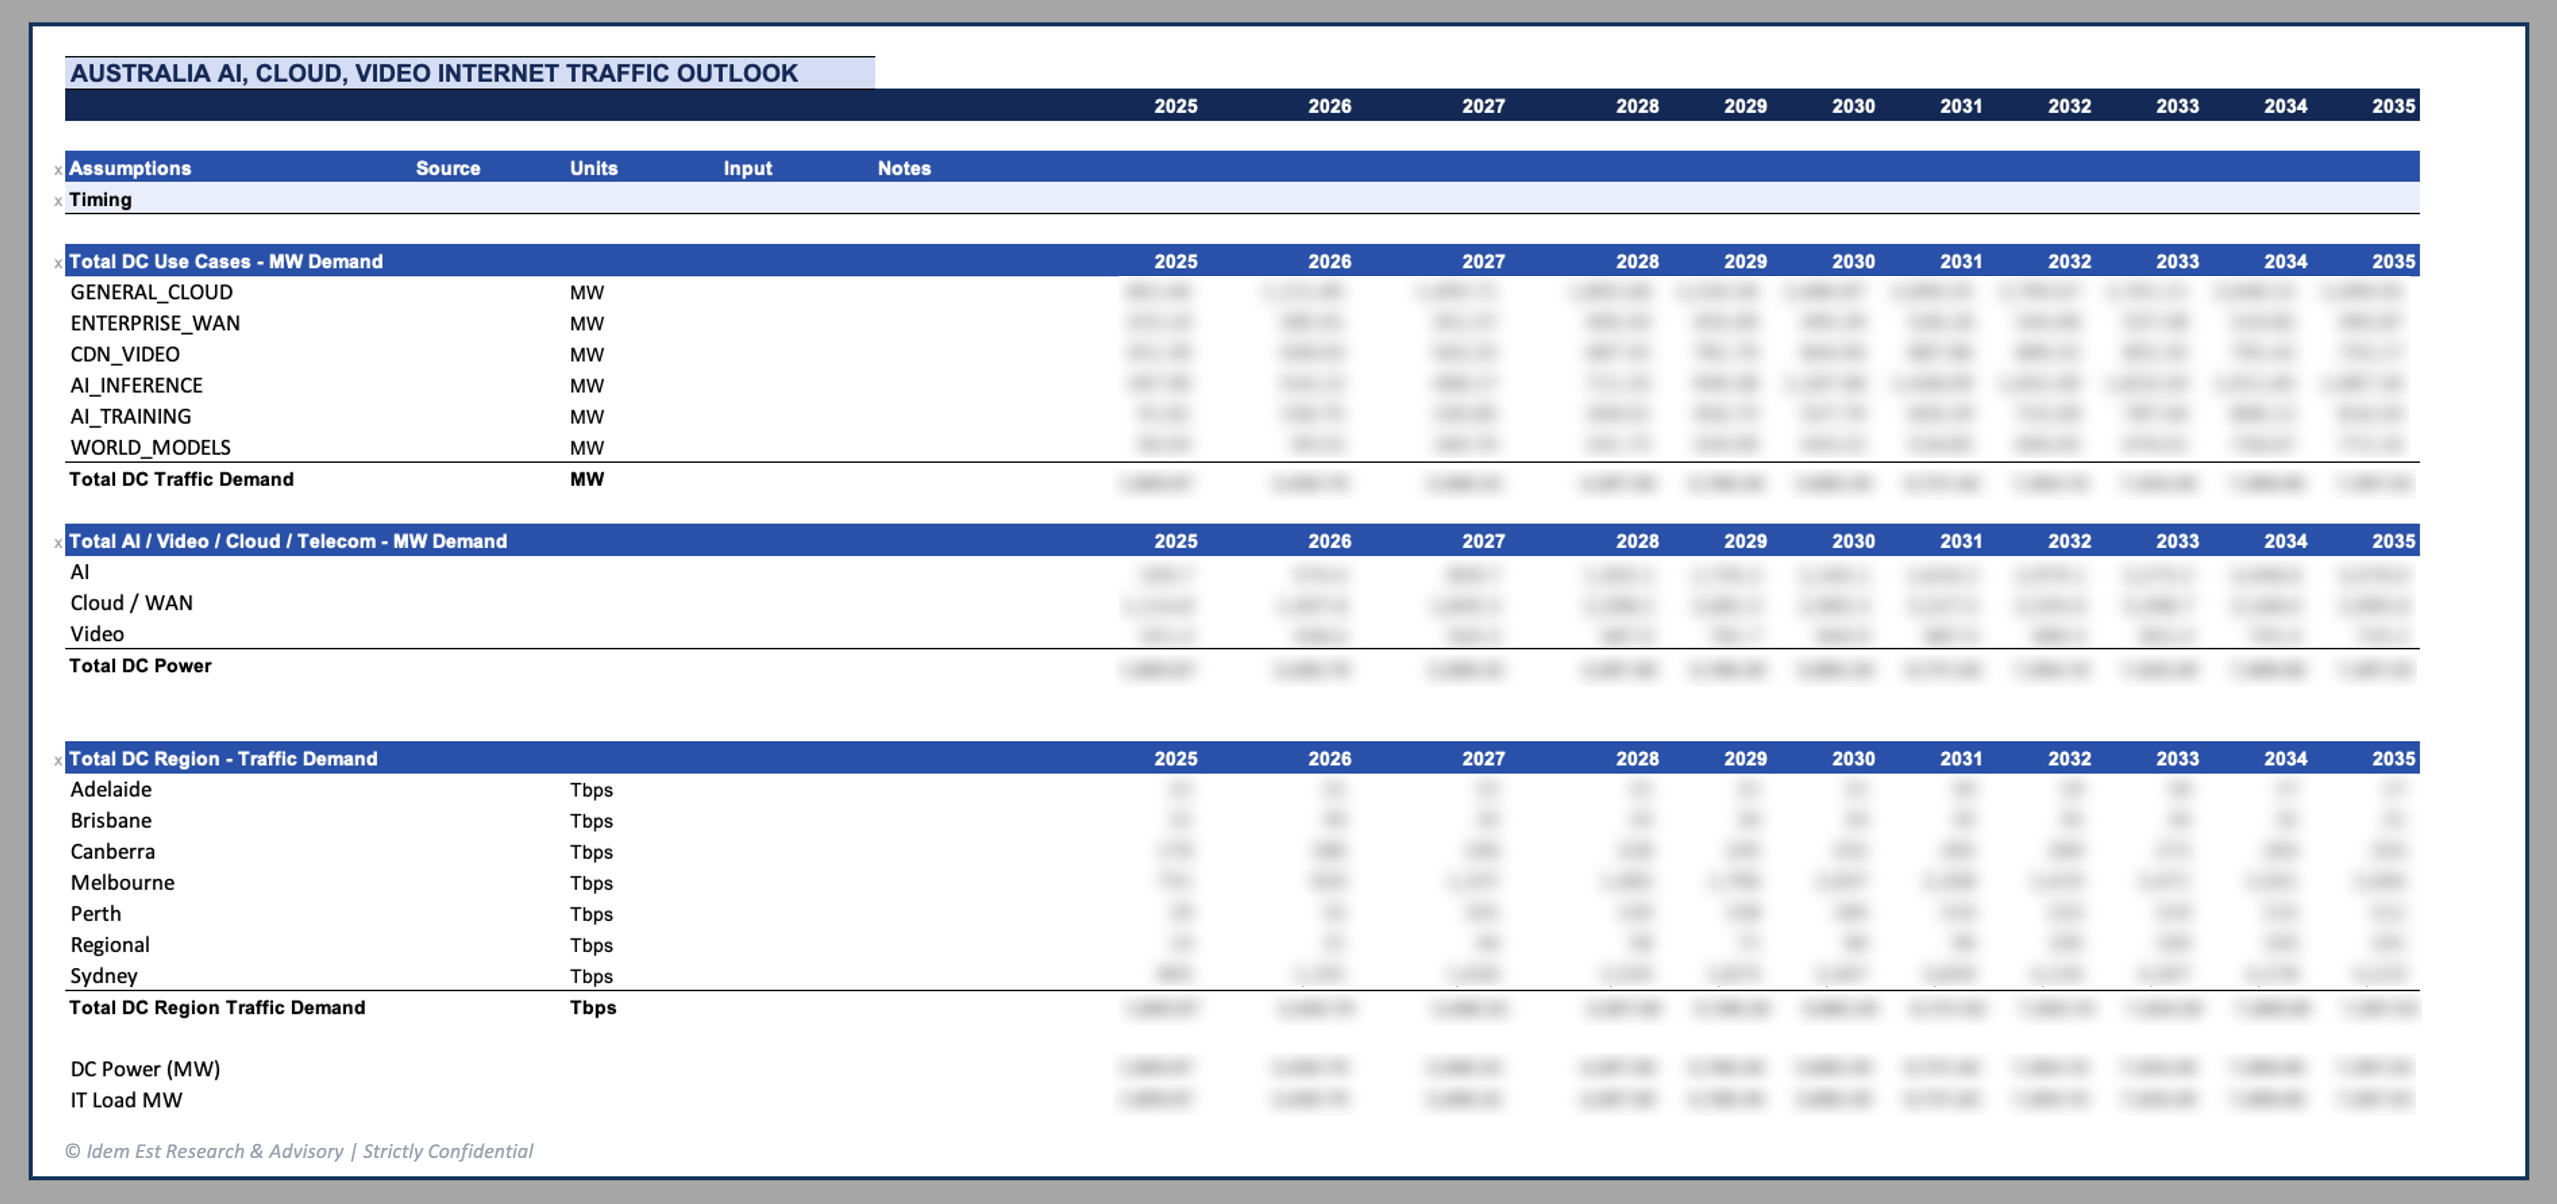
Australia is used as a public capability showcase: the modelled view shows IT load rising from 1.5 GW in 2025 to 10.5 GW by 2035, with AI-related workloads representing roughly 55% of 2035 demand and major connectivity pressure emerging in Sydney West and Melbourne West.
Best for: fibre and network providers, investors, infrastructure strategy teams, public sector, and advisory firms
Focus: AI demand, cluster MW growth, and connectivity outlook
Access: proposal-led and custom scoped
Australia AI demand and connectivity forecast: public sample view
|
Forecast metric |
Australia sample output |
|---|---|
|
IT load / capacity baseline |
1.5 GW, 2025 |
|
IT load / capacity forecast |
10.5 GW, 2035 |
|
CAGR, 2025–2035 |
~22% |
|
Operational data centre sites |
166 |
|
Pipeline data centre sites |
106 |
|
Largest current hub |
Sydney |
|
Secondary hub |
Melbourne |
|
Emerging hub |
Brisbane |
|
Secure / government workload node |
Canberra |
Figures are modelled market-screening outputs for strategy, prioritisation and planning. They are not a substitute for site-specific engineering, power-procurement or network-design studies.
Modelled 2035 workload mix: Australia sample
|
Workload category |
Share of modelled 2035 IT load |
|---|---|
|
General cloud |
26% |
|
Enterprise / WAN |
3% |
|
CDN / video |
17% |
|
AI inference |
36% |
|
AI training |
14% |
|
Physical AI / edge |
5% |
|
AI-related total |
55% |
In this sample view, AI-related workloads — AI inference, AI training and physical AI/edge — account for 55% of modelled 2035 IT load. AI training is expected to concentrate in larger campus-scale clusters, while AI inference demand emerges more broadly across metro nodes with low-latency requirements.
Australia connectivity hotspots: sample cluster ranking
|
Rank |
Cluster |
Modelled connectivity intensity |
|---|---|---|
|
1 |
Sydney West |
1,340 Tbps |
|
2 |
Melbourne West |
770 Tbps |
|
3 |
Sydney West / Aerotropolis |
493 Tbps |
The connectivity layer estimates where AI, cloud and content workloads are likely to create the greatest network pressure. For network providers, this supports fibre route prioritisation, metro backhaul planning, interconnect strategy and peering ecosystem analysis.
“Tbps figures represent modelled aggregate connectivity demand by cluster under the selected workload-intensity scenario.”
Built for APAC market screening, using Australia as the showcase model
The same approach can be applied across selected APAC markets, including Australia, New Zealand, Singapore, Malaysia, Indonesia, Philippines, Thailand and Vietnam. Outputs can be scoped at national, state, metro, corridor or custom-cluster level.
Built on the same market-screening logic as , with additional workload, demand and connectivity modelling layers.
|
APAC use case |
Example output |
|---|---|
|
Market entry |
Which APAC clusters are absorbing the next wave of AI-related MW? |
|
Fibre planning |
Which corridors face the greatest future connectivity pressure? |
|
Data centre investment |
Which markets show the strongest pipeline, utilisation and demand signals? |
|
Public-sector planning |
Where do power, land, water and network constraints intersect with AI demand? |
|
Advisory / strategy |
Repeatable benchmark for client studies and board-level market screening |
Why AI Demand & Connectivity Atlas is different
Most data centre datasets tell you where sites are.
This product helps you understand where demand is going.
The AI Demand & Connectivity Atlas is built to answer questions such as:
-
which clusters are likely to absorb the next wave of AI-related MW?
-
how much of future demand is driven by AI vs cloud or video?
-
where is connectivity demand likely to tighten first?
-
which locations matter most for fibre, backhaul, and interconnect strategy?
What you get with the AI Demand & Connectivity Atlas
The Atlas combines three linked views of the market:
1. Workload-based MW forecast
A forward view of data centre demand by cluster, state, and region.
2. AI workload mix
Demand split across:
-
AI training
-
AI inference
- World Models (Physical AI)
-
cloud / enterprise
-
video / content
3. Connectivity demand outlook
Estimated network demand derived from power and workload intensity, designed to support corridor and cluster prioritisation.
Core outputs
MW demand forecast
- Cluster-level and state-level MW outlook
- Annual GWh and peak MW views
- Forecast horizon to 2030 and 2035
- Workload split (MW and % of total) for Cloud, Video, and AI
- Scenario views for changing demand intensity
AI workload view
- AI training demand
- AI inference demand
- AI share of total MW
- Changing workload mix over time
Connectivity demand view
- Estimated Gbps / Tbps implications
- Cluster rankings by connectivity intensity
- Corridor-level demand perspective
- Support for backhaul and interconnect planning
What decisions it helps
Use the AI Demand & Connectivity Atlas to:
- identify where AI load is concentrating fastest
- compare clusters by future digital infrastructure demand
- prioritise markets for fibre, backhaul, or interconnect investment
- challenge-test public demand assumptions with a bottom-up market benchmark
- support executive strategy, investment, and infrastructure planning
Best-fit buyers
Fibre and network infrastructure providers
Prioritise markets where AI-driven connectivity demand is likely to emerge first.
Investors and digital infrastructure strategy teams
See which clusters are absorbing real growth and how demand mix is changing.
Government and infrastructure agencies
Understand where load growth, AI uptake, and connectivity needs are most likely to concentrate.
Advisory and research teams
Use a repeatable benchmark for market studies, client strategy, and infrastructure assessments.
Methodology summary: how the AI Demand & Connectivity Atlas is built
The Atlas starts with a bottom-up data centre market view, including site inventory, operator presence, lifecycle status, pipeline activity and capacity indicators. It then applies workload allocation, utilisation and ramp-up assumptions to estimate total IT load, AI share of demand, workload mix and connectivity implications by cluster and corridor.
Outputs are designed for market screening, strategy, investment prioritisation and infrastructure planning. They are not intended to replace engineering studies, utility interconnection studies or site-specific network design.
Country coverage available now
- Australia 270+ (170+ operational, 100+ future DCs)
- Indonesia
- New Zealand
- Malaysia
- Philippines
- Singapore
- Thailand
- Vietnam
- Need another geography? Tell us what to prioritise next.
- Custom market cuts and multi-country packages are also available.
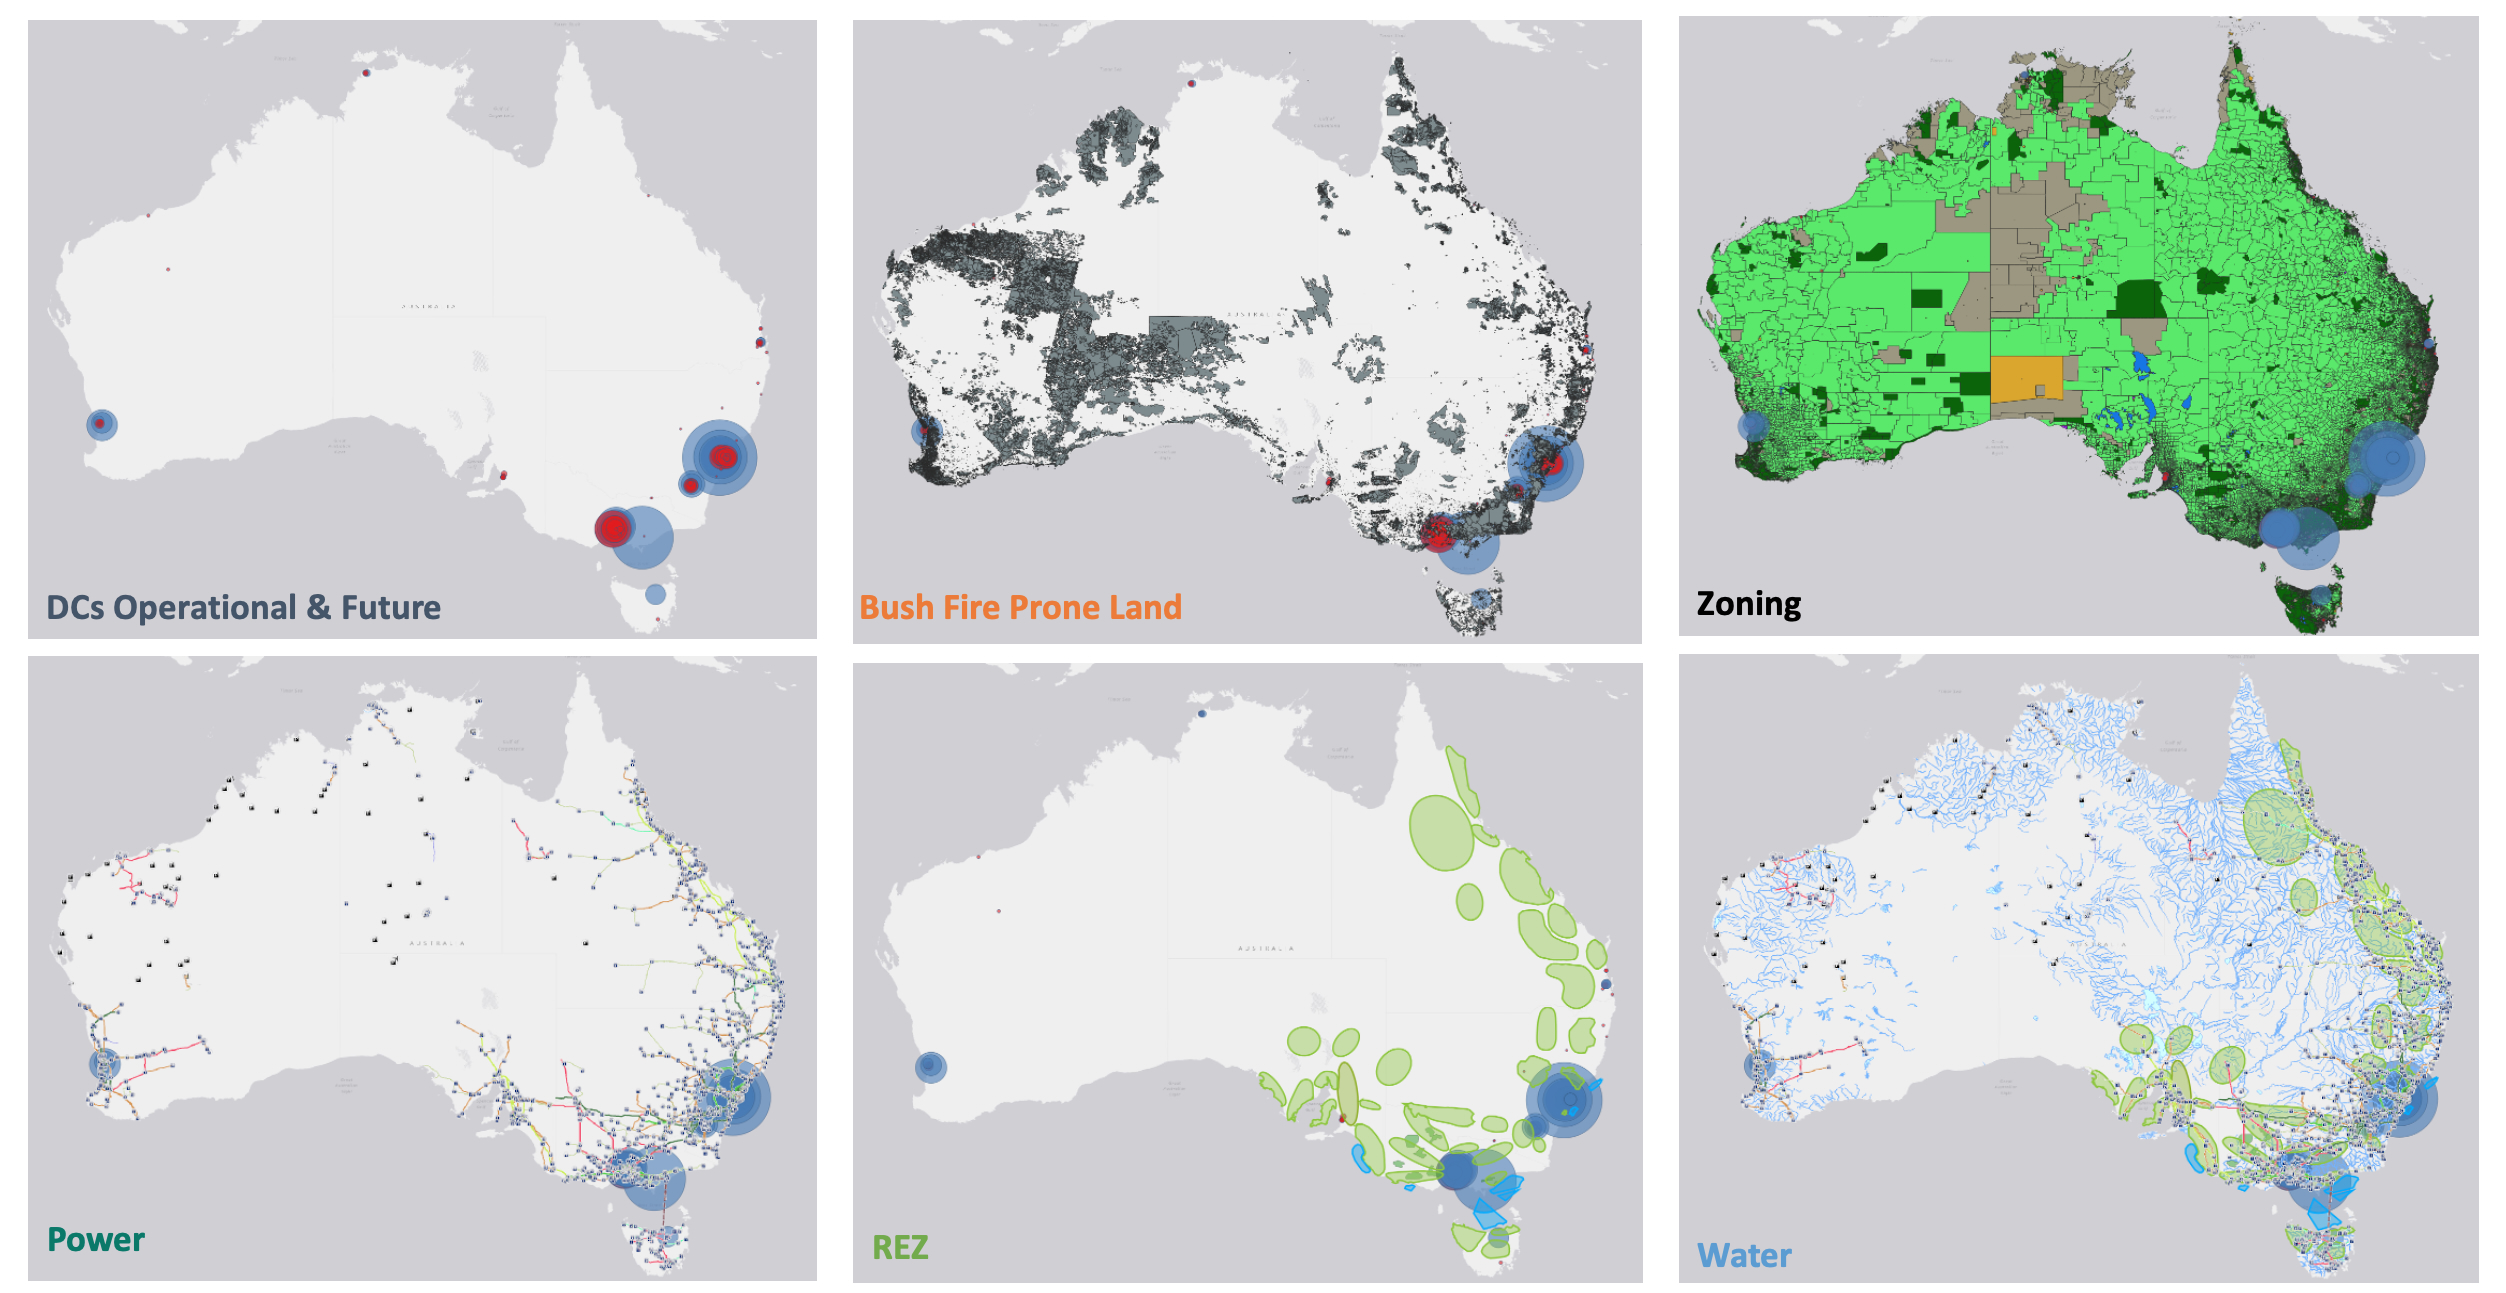
Optional add-ons
Government and utilities geospatial add-on
Available separately for clients who need planning overlays such as zoning, grid proximity, water, and environmental constraints.
Custom cluster cuts
Available for regional, national, or bespoke market groupings.
Quarterly benchmark updates
Available for clients who want a standing market and demand tracker.
Delivery formats
Choose the format that fits your workflow:
- Presentation/ Executive Briefing
- CSV (Excel compatible)
- KML/KMZ (easy viewing and sharing in Google Earth)
- GeoJSON (web mapping and modern data stacks)
- SHP (Shapefile for GIS tools)
Request a briefing
Tell us your priority markets, and we will prepare a short sample view and discuss the most relevant workload and connectivity outputs.
Send email to: landry@idemest.com
Data for market intelligence, sourcing, diligence, and network planning.
Other Idem Est Research Telecoms Country Reports:
APAC Data Centre Database & Pipeline Atlas – Track APAC data centre supply, pipeline activity and cluster formation
AI Demand & Connectivity Atlas – Forecast where AI-driven data centre demand lands across APAC
ASEAN-4 Internet Exchanges & CDNs – Analysis of IX capacity, CDN deployment, and hyperscaler strategies in the ASEAN region
Australia, Bangladesh, China, India, Indonesia, Japan, New Zealand, Malaysia, Myanmar, Pakistan, Philippines, Singapore, South Korea, Taiwan, Thailand, Vietnam – A concise, data-driven overview of the country’s telecom market
Asia Pacific Telecom Towers – Market snapshot of tower ownership, tenancy ratios, lease rates, build-to-suit pipelines, and M&A across APAC.
Asia Pacific Satellite Internet, – Analysis of GEO/MEO/LEO capacity, coverage, pricing, and regulatory environments across APAC
Starlink Company Profile, – Deep dive on Starlink’s network architecture, satellite fleet, spectrum/licensing, pricing, and product roadmap (residential, business, mobility, backhaul). Includes competitive landscape, partnerships, regulatory status by key markets, and revenue/ARPU trajectory
Starlink Country Data Tracker – Starlink availability, by country, monthly subscribers update by country (160+)