Description
DC Database Atlas Core
A practical data centre tracker for Australia and selected APAC markets. Use it to see where sites are, who operates them, what is live vs planned, and how clusters are forming. Designed for market mapping, pipeline tracking, portfolio benchmarking, and target shortlisting.
The practical data centre tracker for market mapping, pipeline visibility, and target screening.
Get a clean, ready-to-use view of data centre sites, operators, and development activity across your chosen market. DC Atlas Core helps you move faster on market research, portfolio tracking, investment screening, and business development.
Best for: strategy teams, investors, contractors, consultants, and market entrants
Delivery: CSV, GeoJSON, SHP, KML/KMZ
Coverage: country packs and custom market cuts
Why teams use DC Database Atlas Core
DC Database Atlas Core is built for teams that need a consistent market view without building a data centre database from scratch.
Use it to:
-
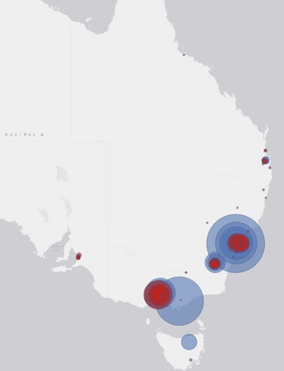
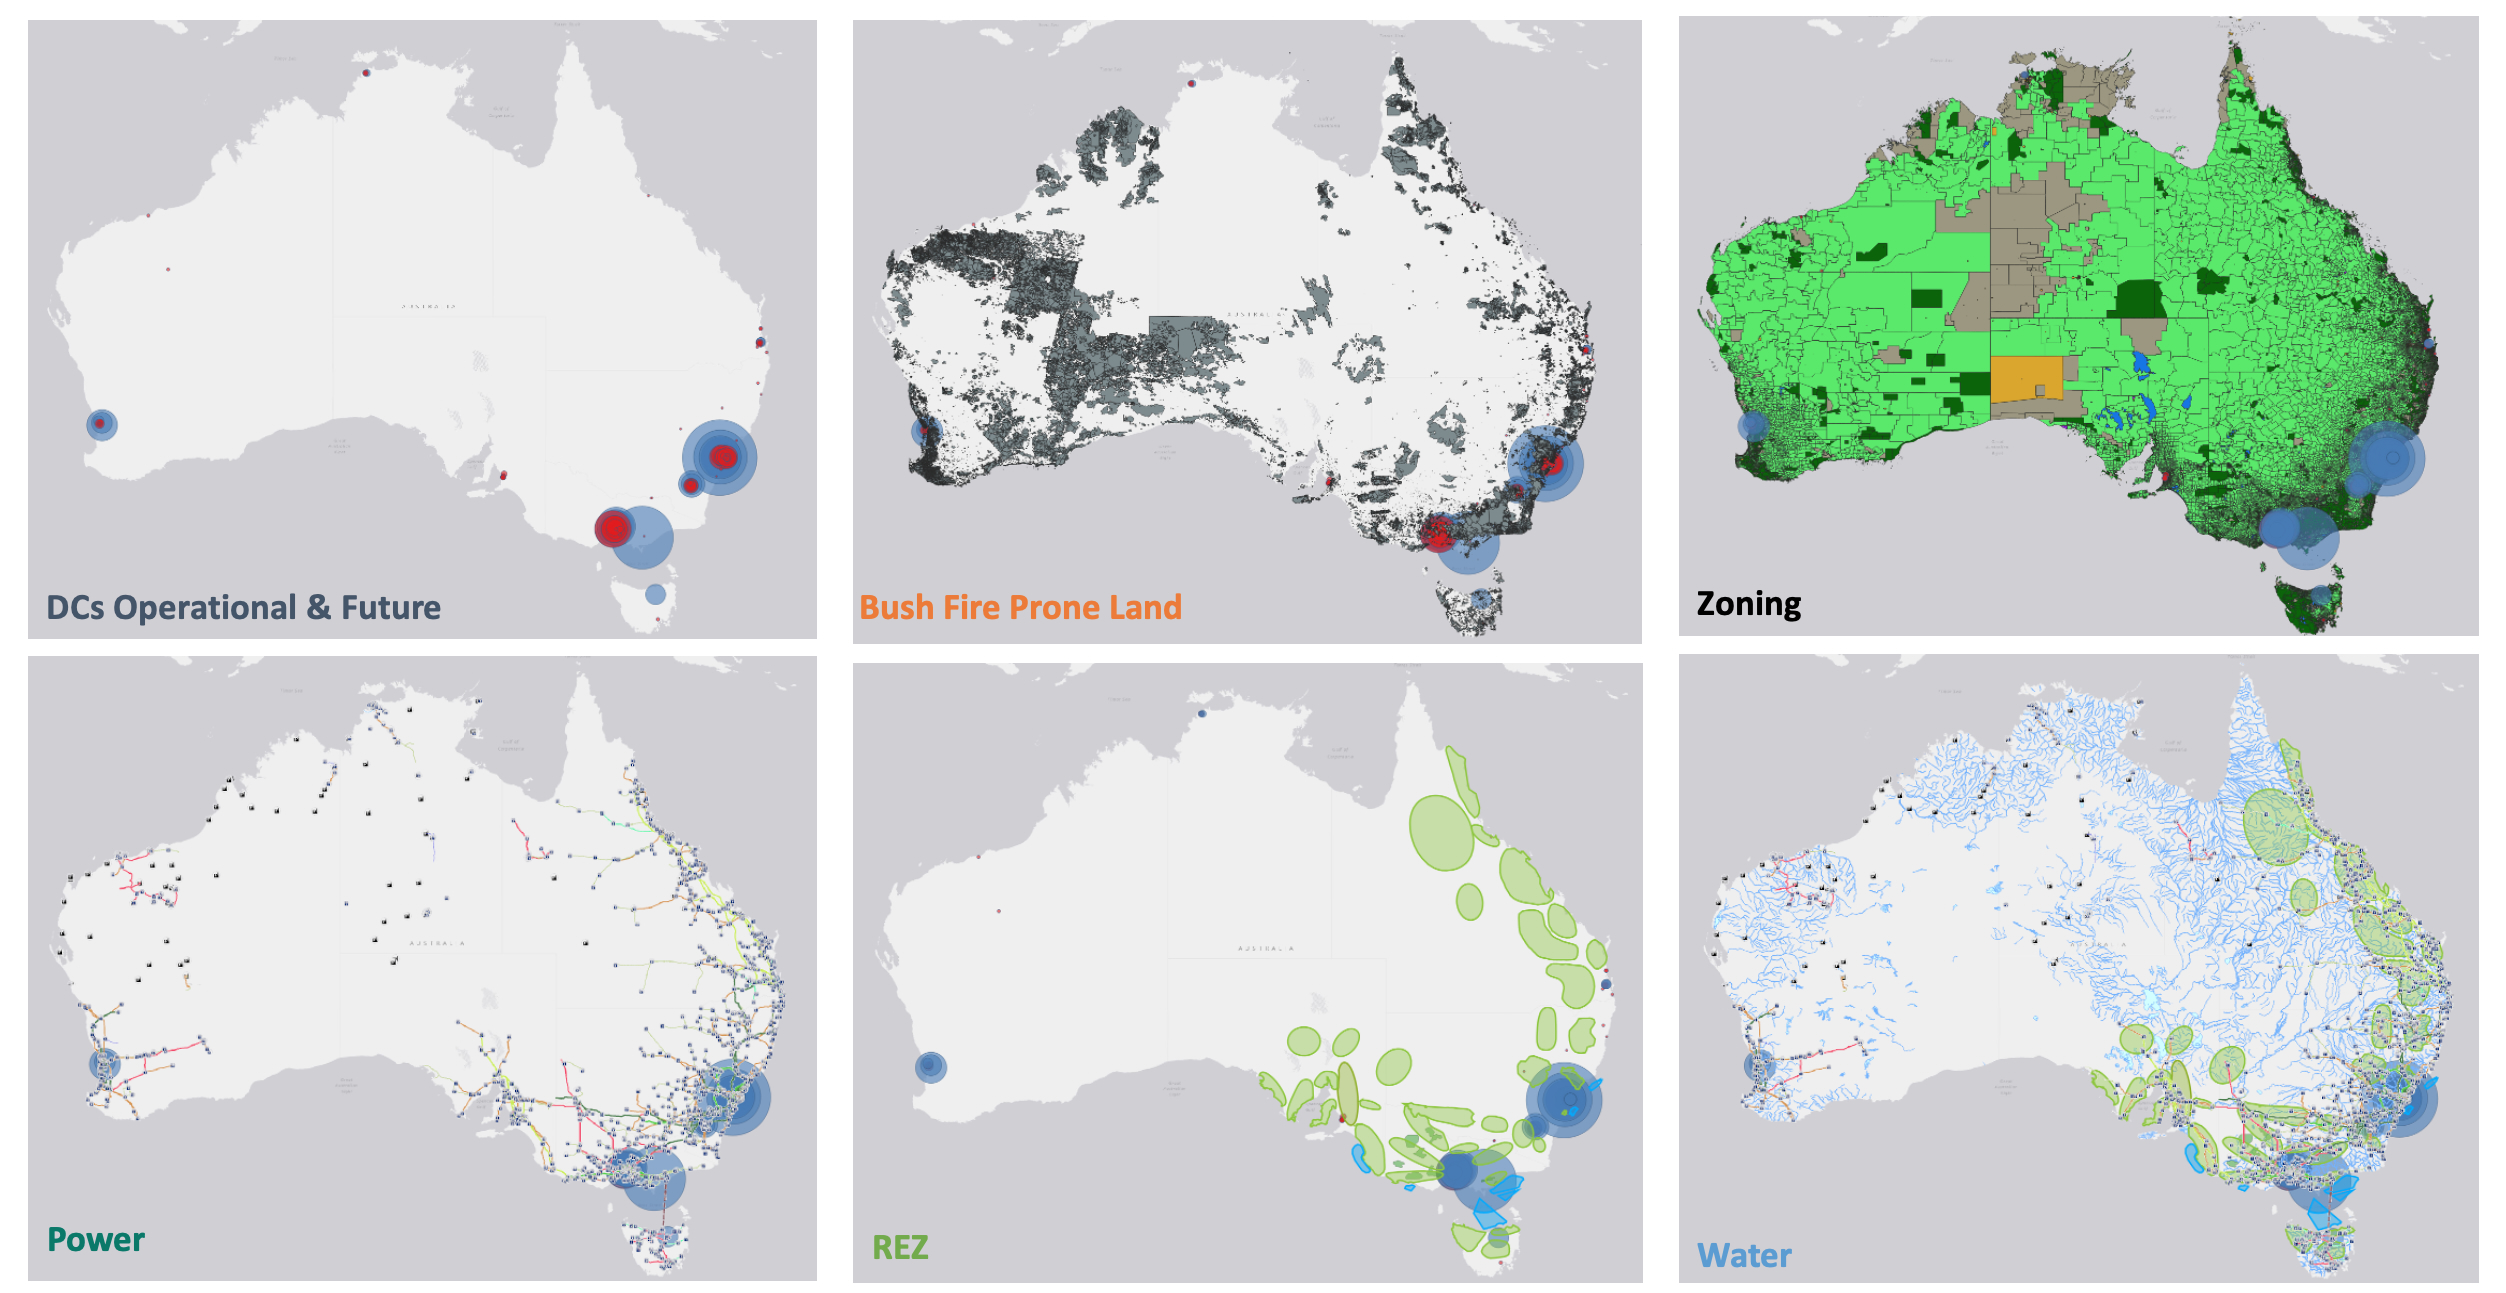
- map live and future data centre sites
- track operators and site portfolios
- distinguish operational, committed, planned, and future projects
- identify where growth is concentrating by city, cluster, and region
- build internal target lists for investment, sales, or procurementDC market intelligence and sourcing
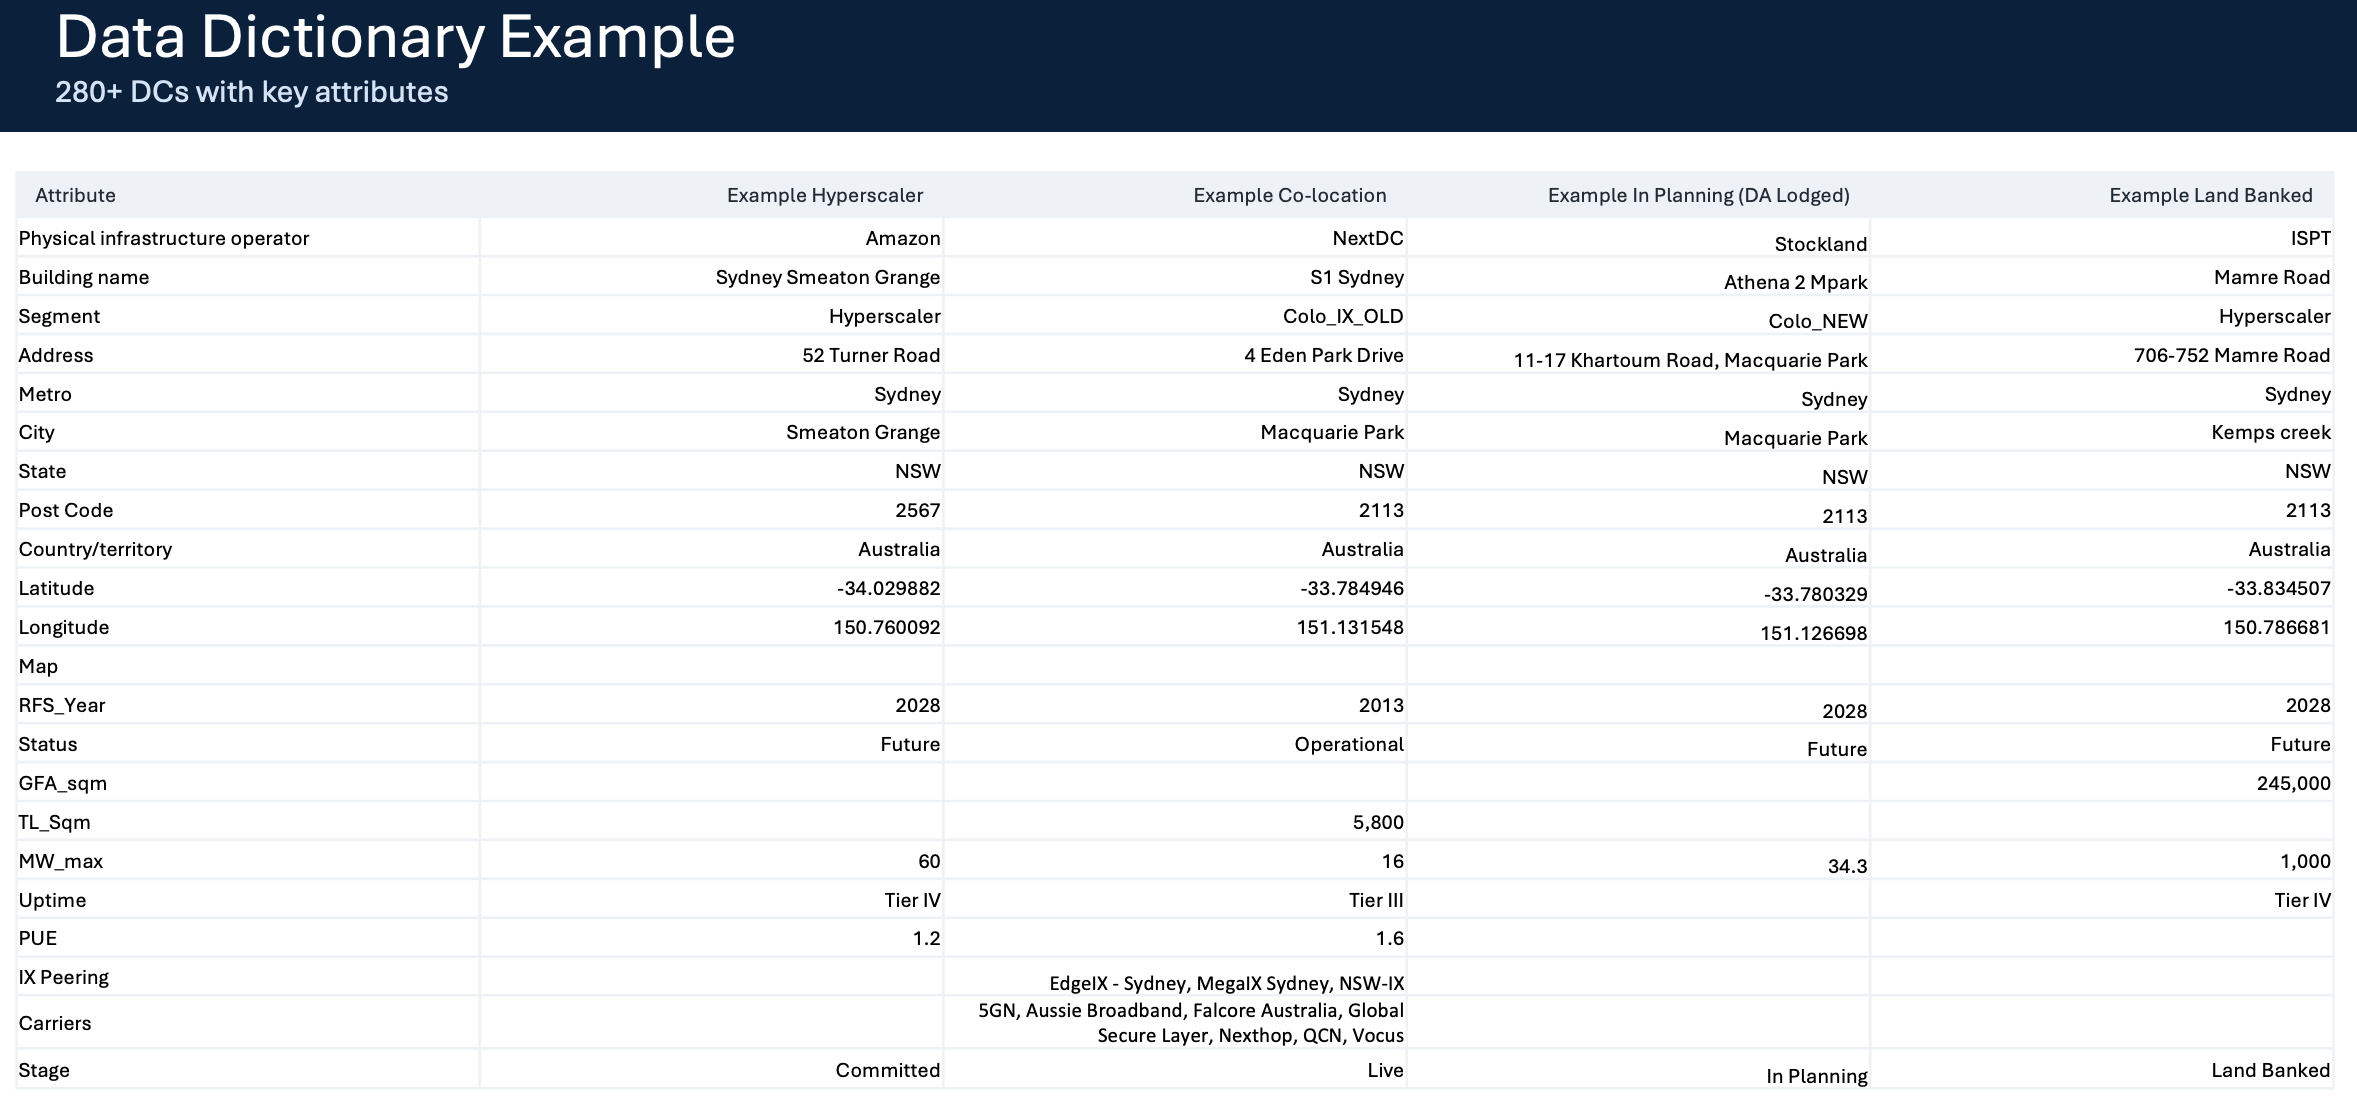
What is included in the DC Database Atlas Core
Each Atlas Core pack includes a structured data centre tracker with practical fields for analysis and mapping.
Core fields include:
- site name
- operator / company name
- site and company IDs
- address and geocode
- city, market, state, and country
- lifecycle stage
- listing / project status
- site type and capacity indicators
- built-out MW
- Power ramp-up profiles
- whitespace
- PUE
- year online
- building size
- site code
- tier and infrastructure notes
- Need additional attributes? Share your requirements. Many fields can be added on request.
Country coverage available now
- Australia 280+ (180+ operational, 100+ future DCs)
- New Zealand
- Malaysia
- Indonesia
- Thailand
- Vietnam
- Need another geography? Tell us what to prioritise next.
- Custom market cuts and multi-country packages are also available.
Target Audience
Built for decision makers who need data centre clarity, fast.
Past clients include
-
Data Centre Real Estate Investment Trusts (REITs): market mapping, portfolio benchmarking, and diligence support
-
Data Centre Construction Contractors: pipeline visibility, opportunity sizing, and bid prioritisation
-
Data Centre Infrastructure Providers: network planning, coverage analysis, and target account selection
-
New entrants: fast market orientation, competitor mapping, and site shortlisting
-
Consultants, consultancies, and advisory firms: repeatable market research, client deliverables, and modeling inputs
-
Corporate and government agencies: planning and procurement support, regional capacity monitoring, and infrastructure strategy
What makes it useful
DC Atlas Core is designed to be easy to use across strategy, BD, and market intelligence workflows.
It helps teams:
- create a consistent market map in minutes
- benchmark operators and portfolios across locations
- monitor pipeline movement over time
- support internal briefs and market presentations
- reduce time spent assembling fragmented market data
Typical DC Atlas Core use cases
Investors and strategy teams
Track market structure, cluster formation, and portfolio exposure.
Construction and delivery teams
Monitor pipeline activity, identify active markets, and prioritise opportunities.
Consultants and advisory firms
Use a repeatable source for market sizing, benchmarking, and client work.
New entrants
Build fast market orientation and shortlist sites, operators, and clusters.
Delivery formats
Choose the format that fits your workflow:
- CSV (Excel compatible)
- KML/KMZ (easy viewing and sharing in Google Earth)
- GeoJSON (web mapping and modern data stacks)
- SHP (Shapefile for GIS tools)
Update Options
Choose the update cadence that matches your needs:
- one-off delivery
- six-monthly updates
- quarterly updates
Request a sample
Tell us your geographies and preferred format. We will send a sample extract, the schema, and a short methodology note for the bandwidth modeling.
Send email to: landry@idemest.com
Product type: Country-level or custom market data centre tracker
Use cases: market mapping, pipeline tracking, portfolio benchmarking, target screening
Formats: CSV, GeoJSON, SHP, KML/KMZ
Update options: one-off, six-monthly, quarterly