
GLOBAL STARLINK INTELLIGENCE
Track Starlink subscriber growth across nearly 200 countries and territories.
2021–2026 history • Monthly data • ~200 markets • Country-level estimates
Excel database • CSV option • Monthly or quarterly delivery • Institutional licensing
200+
COUNTRIES & TERRITORIES
Global market coverage
MONTHLY
Tracking
Country-level subscriber updates
2021+
HISTORY
Consistent historical series
DIRECT + MODELLED
EVIDENCE
Multiple validation sources
One consistent global view
Global Starlink totals only tell part of the story. The Tracker shows where the subscribers are.
Starlink periodically discloses global subscriber milestones, but detailed country-level adoption remains fragmented. The tracker builds a consistent monthly view of subscriber growth using regulatory disclosures, company information, market evidence and proprietary modelling.
FLAGSHIP PLATFORM
Country Subscriber Intelligence
Track subscriber development at country and regional level through a consistent historical series.
- Subscribers by country
- Monthly observations
- Regional totals
- Historical estimates
- Market penetration trends
- Growth inflections
Continuously Maintained
Market & Launch Intelligence
Identify where Starlink is active, expanding or approaching commercial availability.
- Commercial availability
- New market launches
- Regulatory developments
- Pre-launch markets
- Country status
- Market observations
EVIDENCE FRAMEWORK
Evidence & Validation
Estimates are reviewed against the strongest available direct and indirect evidence.
- Regulatory disclosures
- Starlink disclosures
- Government information
- Reseller evidence
- Market indicators
- Historical revisions
Example Output
One global dataset. Country-level visibility.
The tracker is delivered as a usable analytical database rather than simply a narrative report.
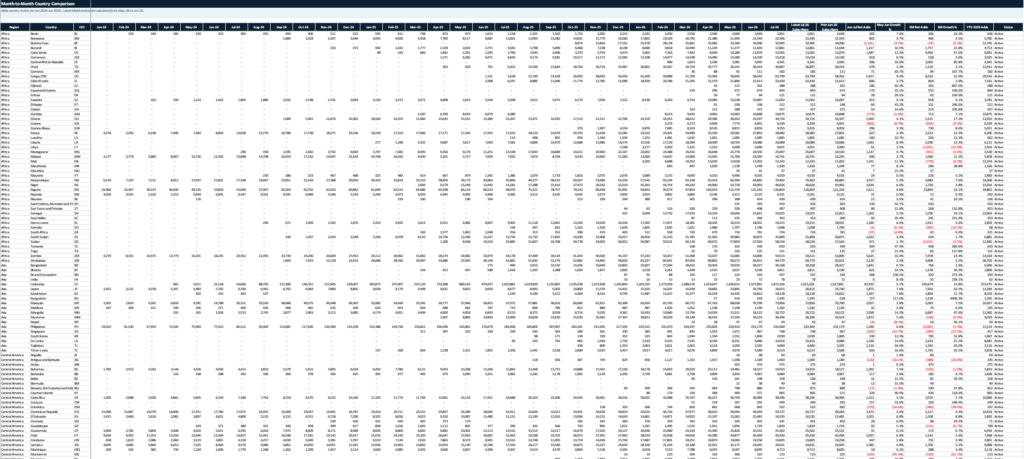
Illustrative extract. Licensed dataset contains the full country-level series.
Structured for further analysis
The database provides a consistent country-by-country framework for comparing subscriber scale, growth and market development.
Typical outputs include:
- Country and territory
- Geographic region
- Commercial availability
- Subscriber estimates
- Monthly observations
- Historical series
- Market status
- Direct-evidence indicators
- Source / evidence classification
- Model revisions
Excel and CSV formats support internal modelling, investment research and data-science workflows.
One consistent global view
See the growth that global totals can hide.
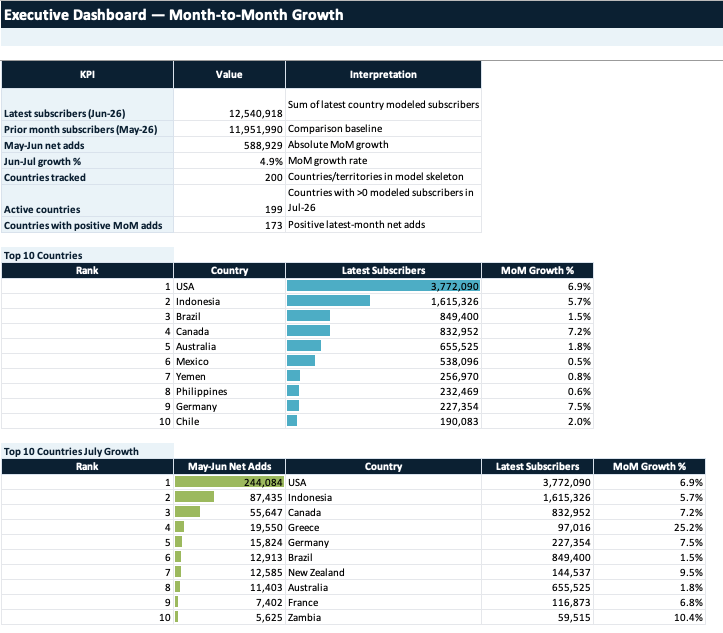
Global subscriber totals mask significant differences in market maturity, adoption and monthly growth. The tracker maintains the underlying country-level series needed to identify where growth is accelerating, slowing or being revised.
Illustrative regional aggregation from the Starlink Subscriber Tracker. Country-level series included in the licensed dataset.
Methdology
A consistent framework for markets with very different levels of disclosure.
No single data source provides complete and current Starlink subscriber counts by country. The tracker therefore combines direct evidence with market-specific modelling and cross-market validation.
01
Direct Evidence
Highest-value observations are incorporated wherever available.
- Regulators
- Starlink disclosures
- Government agencies
- Official statistics
- Resellers and partners
02
Market Evidence
Where direct evidence is incomplete, country-specific indicators provide additional context.
- Broadband market size
- Addressable population
- Commercial availability
- Adoption trends
- Network observations
- Comparable markets
03
Proprietary Model
Evidence is combined into a consistent country-level monthly series.
- Country estimates
- Historical calibration
- Regional validation
- Confidence assessment
- Monthly revisions
- Restatement when stronger evidence emerges
DIRECT EVIDENCE + MARKET EVIDENCE → COUNTRY ESTIMATE → VALIDATION → MONTHLY TRACKER
Methodology explanatory paragraph
Each country is assessed using the strongest available evidence. Direct subscriber disclosures are prioritised where available. Where direct observations are incomplete, estimates are derived using country-specific market indicators and validated against regional and global Starlink totals.
As higher-quality evidence becomes available, historical estimates may be revised to maintain consistency across the dataset.
MONTHLY UPDATE CYCLE
The database evolves as the evidence changes.
Each edition incorporates new market activity, subscriber trends and stronger direct evidence as it becomes available.
New Markets
New Starlink launches and territories are added as commercial availability expands.
Subscriber Growth
Country estimates are updated to reflect the latest monthly adoption trends.
Direct Evidence
Regulatory disclosures and other direct observations are incorporated as they become available.
Historical Restatements
This directly supports the recurring subscription proposition.
USE CASES
Who uses Starlink Subscriber Intelligence?
Built for organisations that need a consistent independent view of Starlink’s geographic growth.
Investment Firms
New Starlink launches and territories are added as commercial availability expands.
Equity Research
Country estimates are updated to reflect the latest monthly adoption trends.
Telecom Operators
Regulatory disclosures and other direct observations are incorporated as they become available.
Satellite & Technology Vendors
New Starlink launches and territories are added as commercial availability expands.
Governments & Regulators
Country estimates are updated to reflect the latest monthly adoption trends.
PACKAGES
Choose the level of intelligence you need.
Purchase the latest global dataset, maintain a quarterly market view or track subscriber development every month.
Current Dataset
US$4,500
For one-off market analysis and benchmarking.
- Latest global dataset
- ~200 countries and territories
- Historical subscriber series
- Latest monthly estimates
- Excel delivery
- CSV option
- Methodology
- Single delivery
Quarterly
US$9,000 / year
For teams requiring periodic monitoring.
- Everything in Current Dataset
- Four updates annually
- New market launches
- Subscriber revisions
- Updated evidence
- Historical restatements
- Version updates
Monthly
RECOMMENDED
US$15,000 / year
For institutional research and continuous monitoring.
- 12 monthly updates
- Full global database
- New-country tracking
- Monthly subscriber changes
- Direct-evidence updates
- Historical restatements
- Excel + CSV
- Analyst support
- Institutional licence option
Licensing
Built for institutional research and analytical workflows.
Institutional licences support use across investment research, data science, strategy and analytical teams while protecting the underlying proprietary dataset.
Analyse
Use the dataset within internal models, forecasts and investment analysis.
Integrate
Import Excel and CSV outputs into internal analytical workflows and research systems.
Protect
Underlying licensed data may not be externally redistributed, sublicensed or resold.
FAQ
Frequently Asked Questions
How many countries are covered?
The tracker provides subscriber estimates and market-status intelligence across approximately 200 countries and territories, including active Starlink markets and selected markets under monitoring.
How frequently is the tracker updated?
The underlying database is continuously maintained. Subscribers can receive monthly or quarterly deliveries depending on the selected licence.
How are subscriber estimates calculated?
The methodology combines direct evidence, including regulatory and company disclosures, with market evidence and proprietary modelling. Estimates are cross-validated across countries, regions and Starlink’s reported global milestones.
Are historical estimates revised?
Yes. Where stronger direct evidence becomes available, historical observations may be restated to improve consistency and accuracy across the series.
What formats are provided?
The tracker is primarily delivered in Excel, with CSV available for customers requiring integration into internal analytical workflows.
Can investment firms use the data in their models?
Yes. Institutional licences permit internal research, modelling and analytical use. Redistribution, resale and external publication of the underlying dataset are subject to the applicable licence.
See where Starlink’s next million subscribers are coming from.
Access the latest global subscriber dataset or maintain a continuously updated view of Starlink adoption with the monthly tracker.
Questions? landry@idemest.com